

The Hospice CEO Scorecard
KPIs Every Hospice Leader Should Track to Predict Future Performance
Outline
Why KPIs Matter
The 10 KPIs… and Three More I Would Personally Include
Conclusion and Call to Action
Why KPIs Matter
Most hospice leaders don't have a revenue problem, a staffing problem, or a cash flow problem. They have a visibility problem.
Financial statements tell you what happened last month. KPIs tell you what's about to happen next.
A declining average daily census today becomes a revenue problem 60 to 90 days from now. Rising accounts receivable today becomes a cash flow problem next quarter. Falling RN productivity today eventually shows up as margin compression and burnout.
The best-performing hospices don't wait for month-end financials to discover problems. They monitor a focused set of operational and financial indicators that serve as an early warning system for growth, profitability, quality, and compliance.
Think of these KPIs as the vital signs of your organization. Just as clinicians monitor a patient's condition before a crisis occurs, hospice CEOs should monitor the health of the business before challenges appear on the income statement.
A well-designed scorecard creates alignment across leadership, helps managers focus on what matters most, and enables faster, more confident decision making. When reviewed consistently, these metrics become more than numbers. They become predictors of future performance.
Simply put: what gets measured gets managed, and what gets managed improves.
KPIs Every CEO Should Know
Average Daily Census (ADC)
ADC is the primary growth indicator. We find reporting both patient days and ADC together gives the best insight.
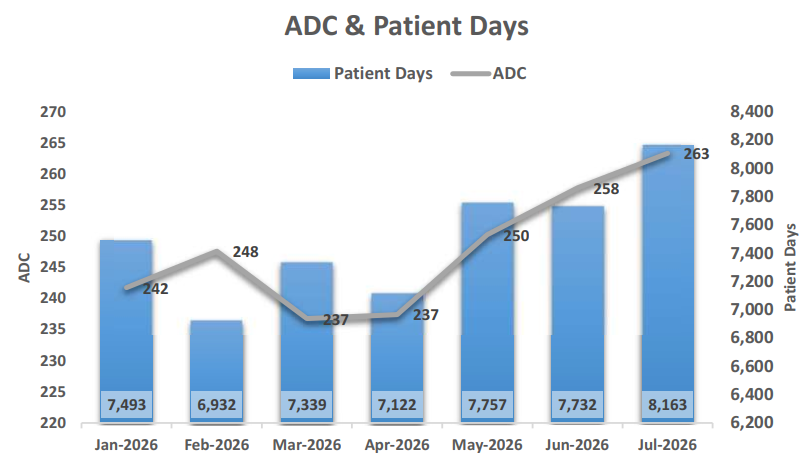
ADC & Patient Days
Length of Stay
ALOS and MLOS reveal referral patterns and sustainability of current admissions criteria and live discharge review practices.
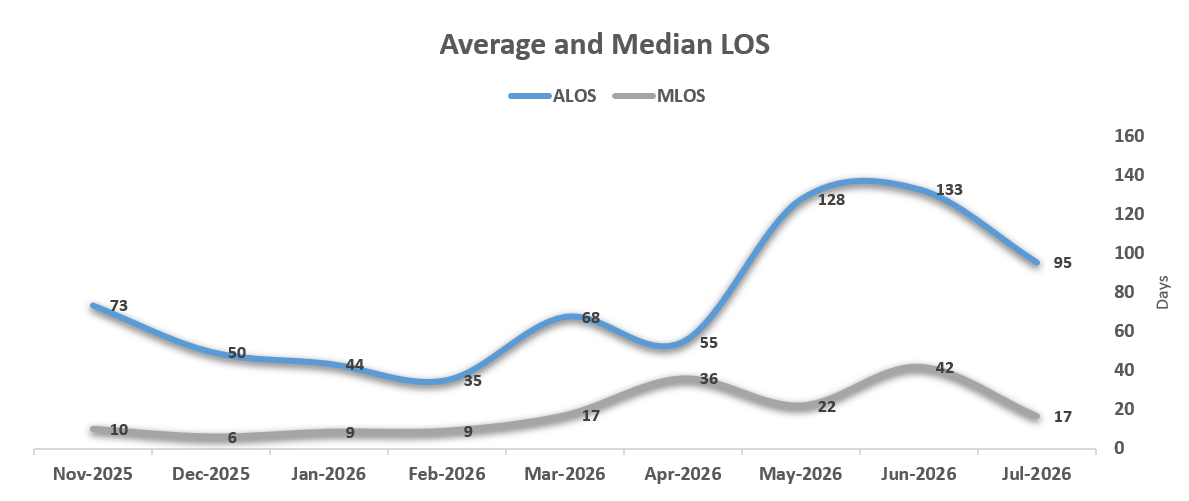
ALOS / MLOS
Live Discharge Rate
Live discharge % measures admission appropriateness. Early flag for potential increased compliance risk.
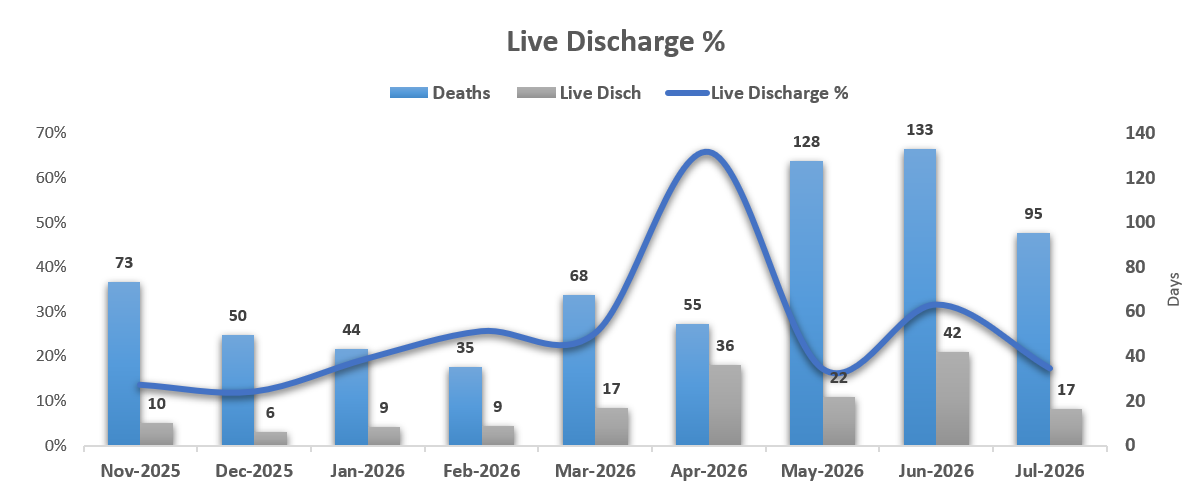
Live Discharge %
Days in AR
Days in AR indicates revenue cycle and collections effectiveness. Look for Days in AR < 45 but especially good is 30-40. When Days in AR runs > 45 especially consistently it spells problems with collections and indecision on the adjustment and write-off process, a.k.a. follow-through with aged receivables.
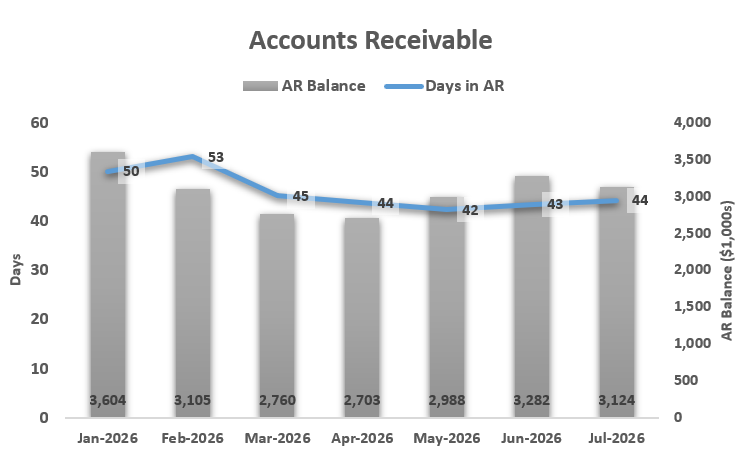
AR Balance and Days in AR
AR > 90 Days
AR Greater Than 90 Days: highlights collection risk. Conversely track AR < 90 Days and target at least 80% as good and > 90% as excellent.
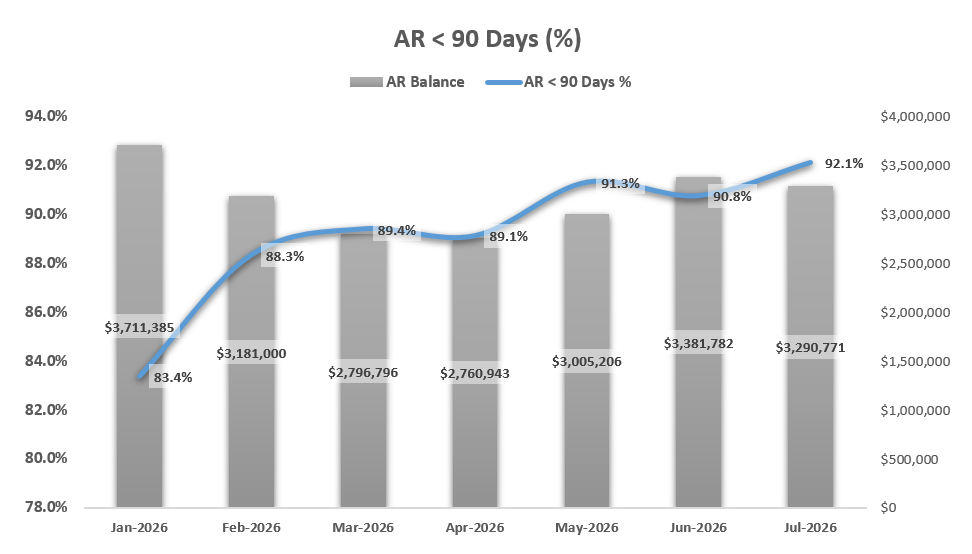
AR < 90 Days %
Staffing Productivity
Productivity balances quality and staffing efficiency. Some reporting allows for FTE staffing, but at the end of the day we find a total budget variance or percentage of revenue model-based accountability method to be the most effective tool for staffing and productivity monitoring. This allows comparisons to include contract staff and PRNs or other labor models along with internal headcount. An alternative would be an FTE to ADC ratio that would show staffing and expected caseload intensity by discipline and program.
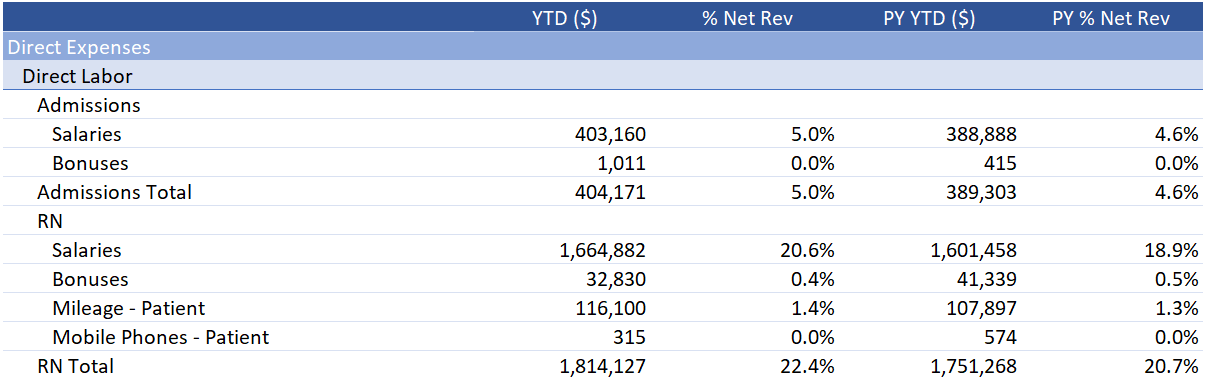
% Net Revenue Admissions and RNs
Revenue per Patient Day
Revenue per Patient Day: tracks reimbursement and level of care trends. Long-stay routine home patients and high adjustments and write-offs bring revenue per diem down, while higher RHC 1-60 patient days and GIP & Respite billed days brings the aggregate per diem up. Tracking the relationship between census and revenue as well as revenue per patient day over time gives a more comprehensive understanding of revenue.
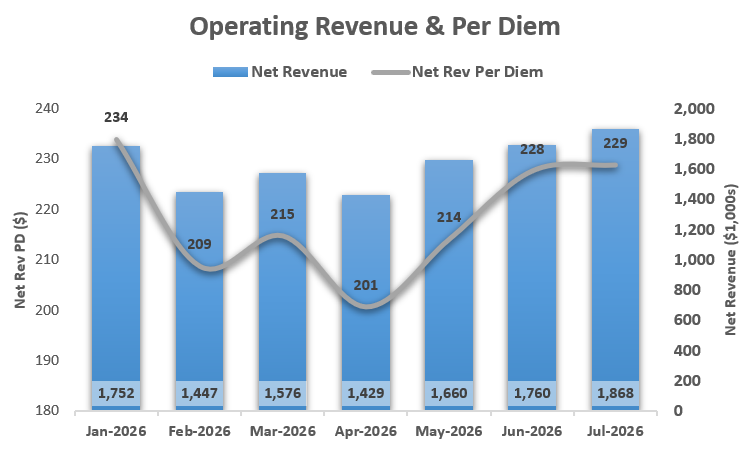
Net Revenue Total and Rev Per Diem ($)
Direct Labor Percentage
One of the most important cost control areas of any healthcare agency is its labor management, especially with direct labor accounting for 60-70% of an agency’s total labor.
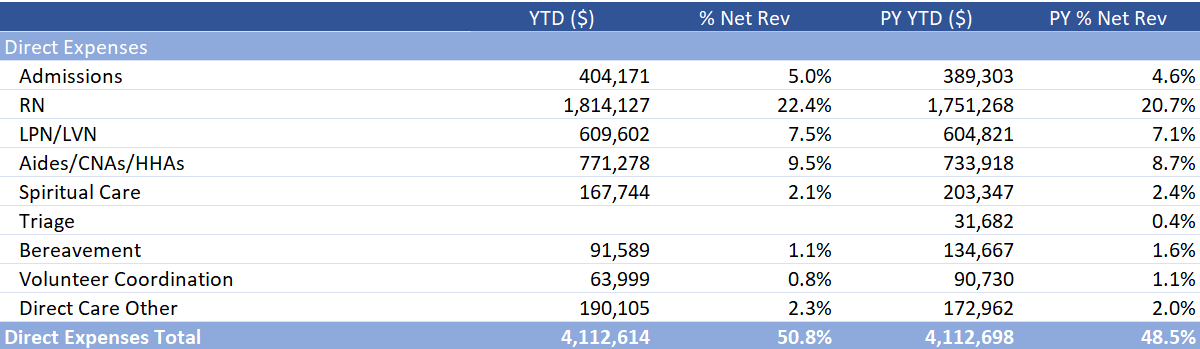
Areas of direct labor as a percentage of Net Revenue
Contribution and Operating Margin by Program
Margins identify program and office performance.
Track margins on both a contribution margin basis and operating income (loss) basis.
Contribution margin represents revenue for a specific program less its direct clinical staffing for that program less patient-related expenses costed to that program. Operating margin includes clinical management, other indirect labor, facility and administrative costs specifically traced and expensed to that program.
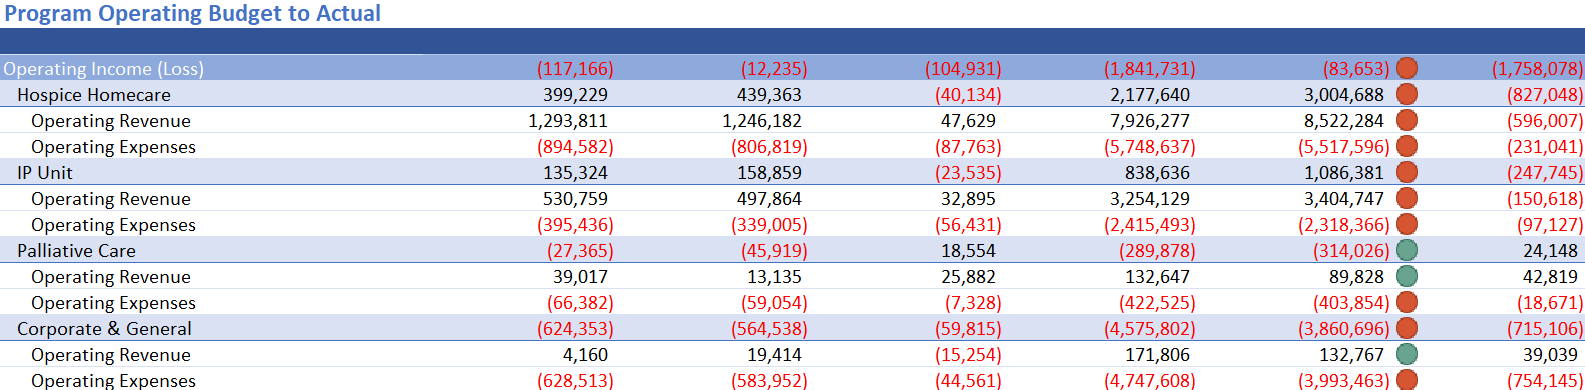
Concise summary of operations by program: revenue, expense, operating income (loss)
Days Cash on Hand
Days Cash measures liquidity strength. Measure both cash and cash and investments on hand so an agency can see both pictures of reserve strength relative to operating expenditures.
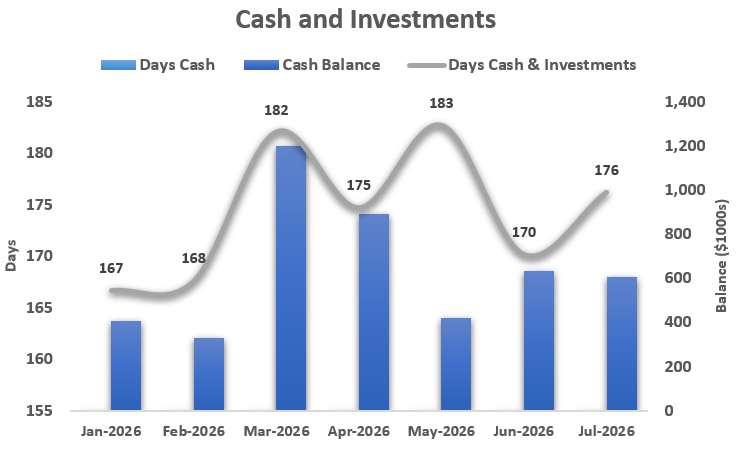
Cash balance and days cash & liquid investments over time
Three Additional KPIs
Additional KPIs I sometimes include are: referral conversion rate, employee turnover, patient days and ADC by level of care, Medicare cap exposure, and net margin.
I also like to include waterfalls to explain beginning to ending changes in key metrics like census and A/R. This perspective gives a more up-to-date view of what has and continues to transpire with census than an ADC trend alone.
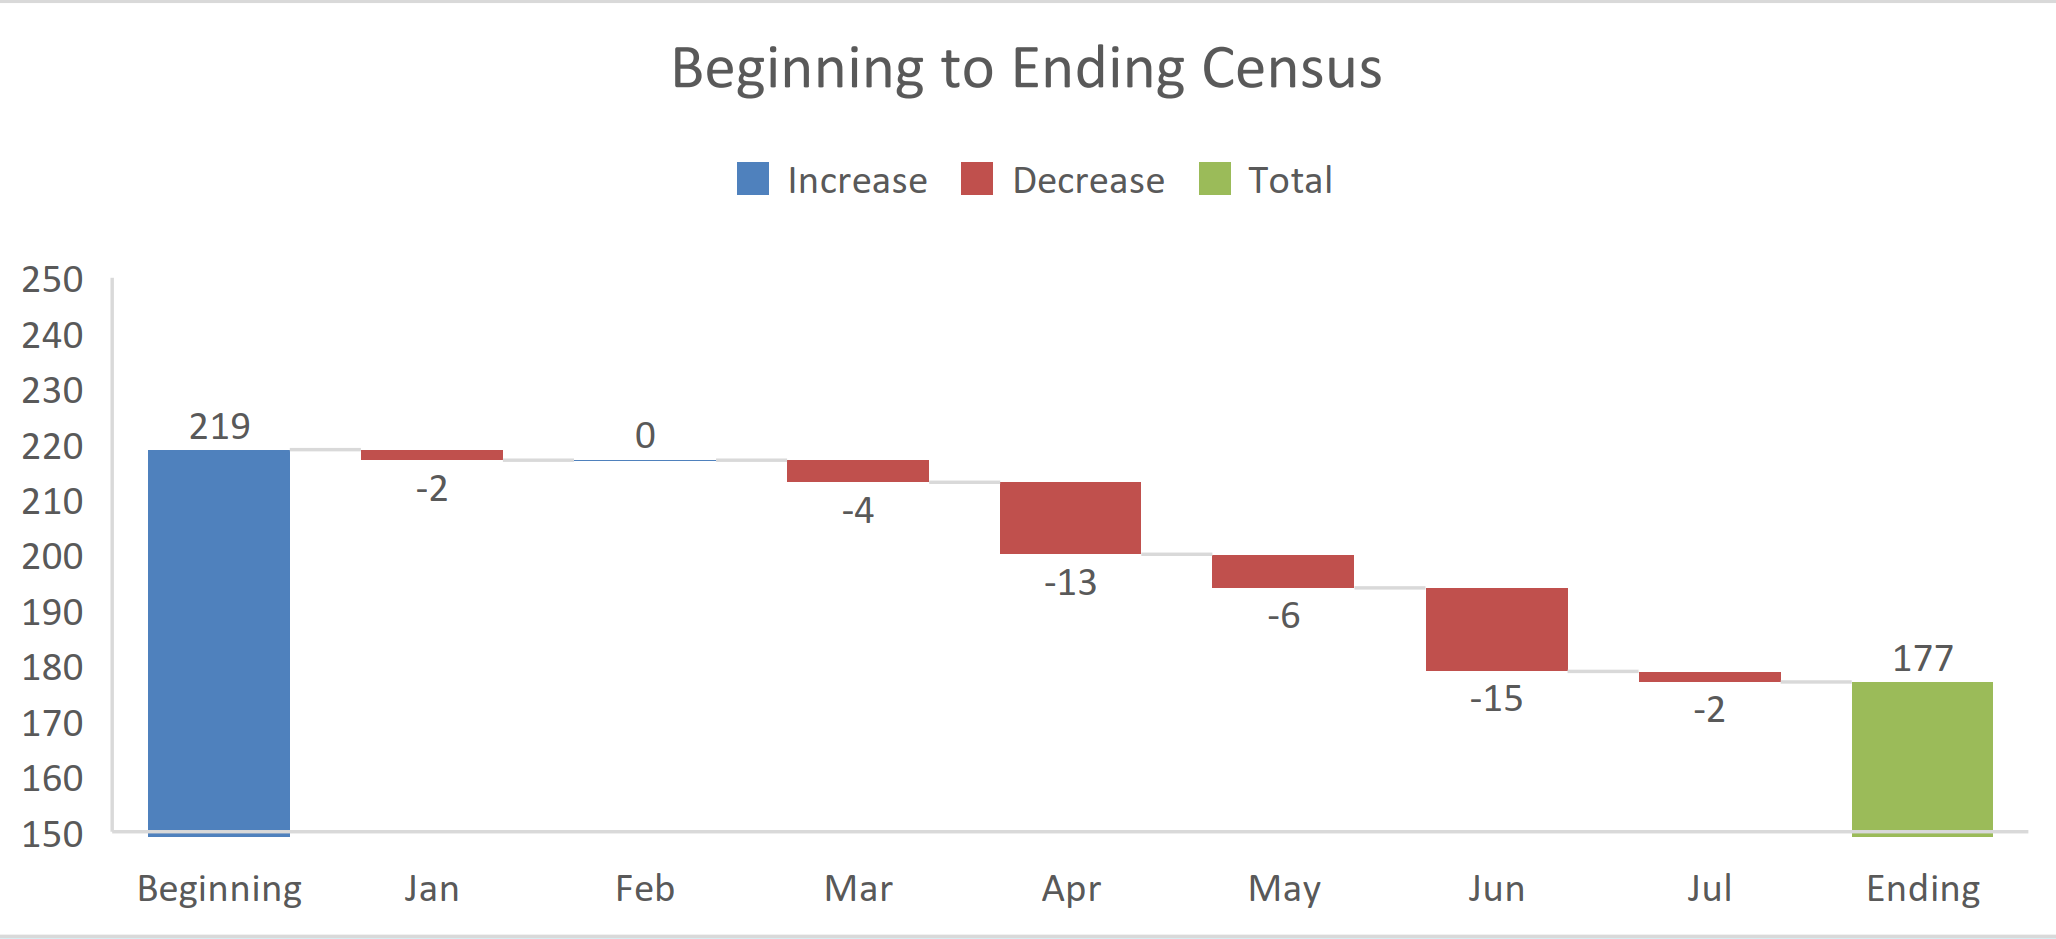
Census waterfall showing downtrend —NOT average daily census but beginning to end census count and change by month
I also can’t help but feel remiss if I didn’t mention two more excellent metrics to include in any set of financial statements.
The first circles back to labor: the number one cost. I like to give financial statement readers an understanding of the relationship between all-in salaries, wages & benefits as a percentage of revenue. Any agency needs to keep an eye on this both at the program and department level of detail but also at the top-level looking down.
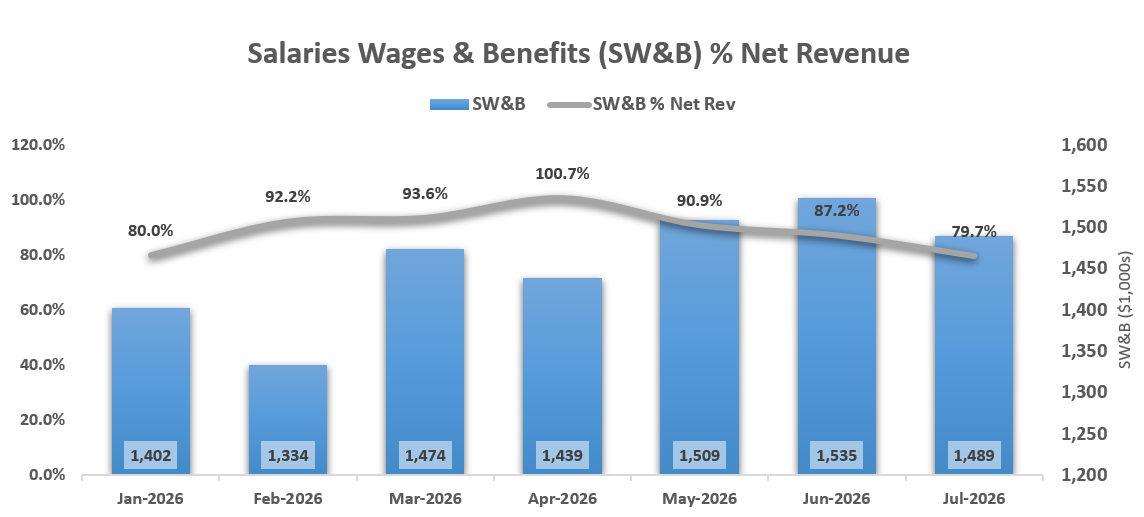
What are overall salaries, wages, and benefits for the organization as a percentage of revenue?
Although a bit more in the weeds than a graph, the second report would be an explanation of key variances in a summary gives readers of financial statements a quicker look at how to reconcile budget to actual for two of the most important numbers: revenue and net income. These variance summaries give the reader at at-a-glance intuitive understanding of where an agency’s net income varies to budget by each major category of the income statement, and the revenue variance quicky ascertains whether volume or rate drives revenue positive or negative to budget or forecast.
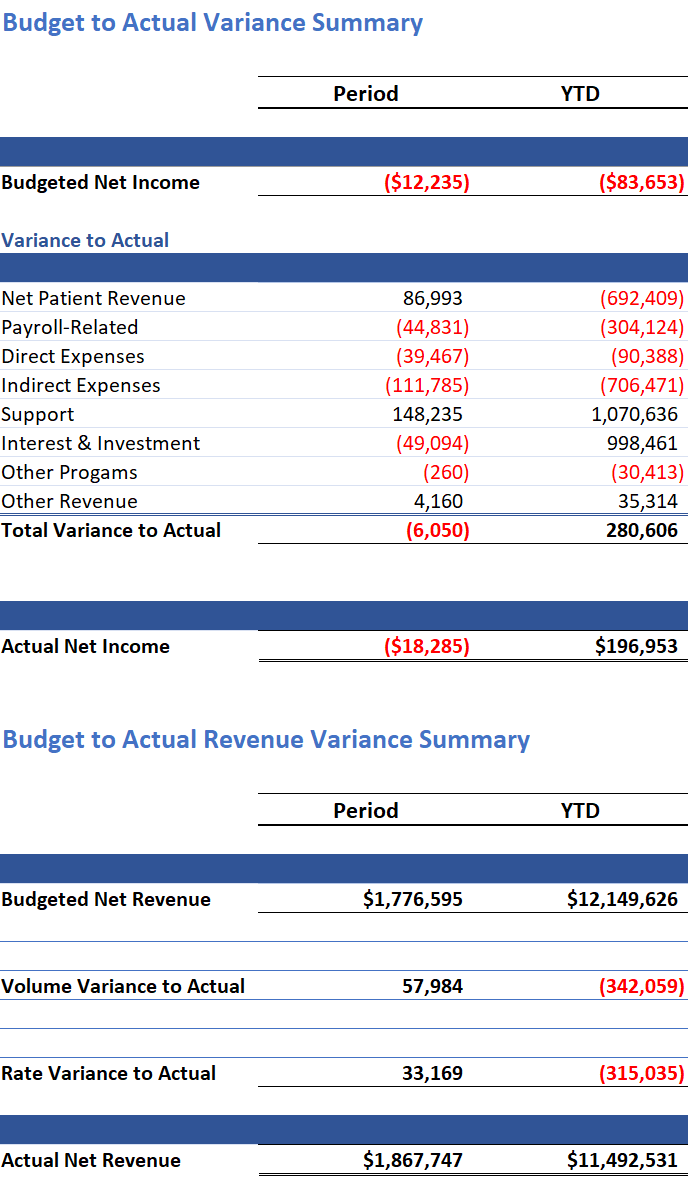
How did our Net Income vary to budget by what major category? How did our revenue vary to budget — how much by volume or rate assumptions?
Conclusion
CEOs should view these measures together rather than in isolation. Rising census with worsening cash flow may indicate billing issues. Improving revenue with declining margins may signal labor inefficiency. Many of these may need to roll up from departments other than Finance, especially employee turnover and some staffing KPIs.
At Blackmor CPA, we help hospice leaders convert operational data into executive scorecards, benchmarking, forecasting, and actionable insights through our CompassBI platform and specialized finance team support roles.